A/B Significance Test - You may be doing it wrong.

Did that calculator really confirm your test was statistically significant?
Running A/B tests can be extremely beneficial and also exciting. That's why everyone who runs them likes to watch as the results stream in. This can be a huge problem, especially if you:
- End the test once it reaches statisitcal significance.
- Continue to run the test until it shows statisitcal significance.
- Look at every possible metric to see what changes.
Both of these actions will show false positives.
To prove this, I searched google for a "A/B Test Signifcance Calculator" and grabbed the code from one of the top results.
I want call out from where, as there is nothing wrong with the calculator and this is an issue inherent in basically all of them.
This specific calculator stated that the result was signifcant if certainty was greater than 95%.
Some people push for 97%, others 99%, but 95% is a good benchmark. I then generated random data and ran it through the calculator.
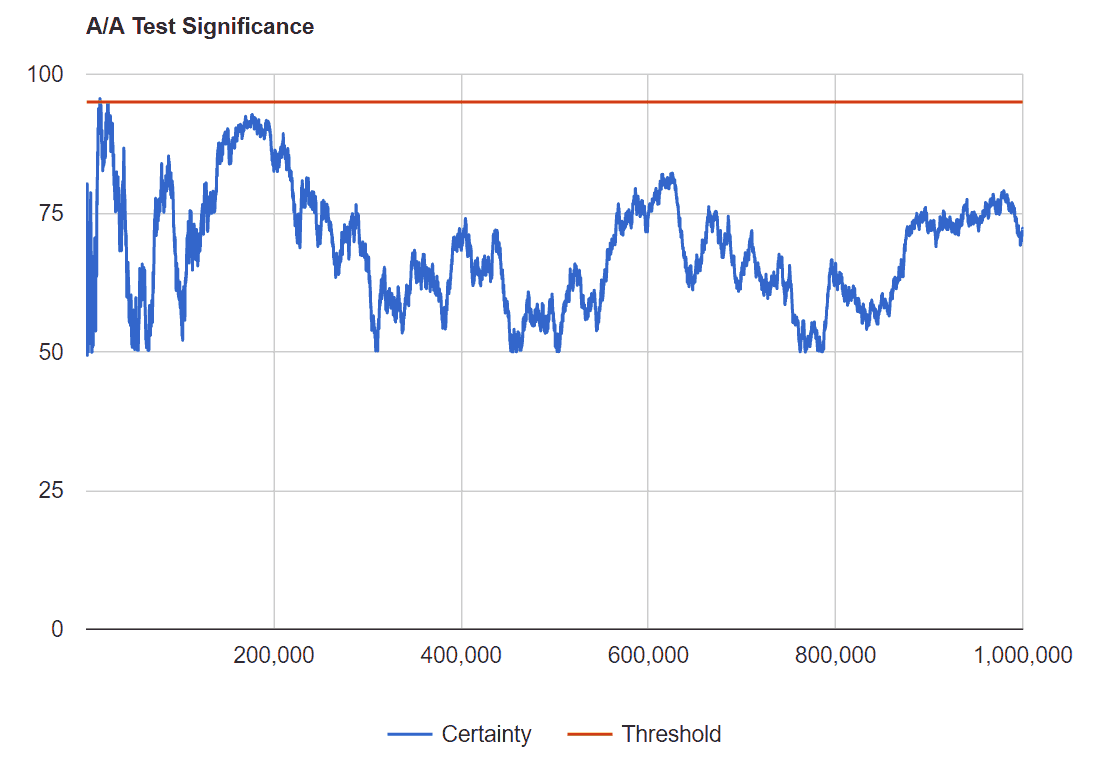
I then graphed the results. The x-axis is the sample size, the y-axis represents certainty. Remember that anything over 95% should be considered a conclusive test and that all data is randomly generated making this the ideal A/A test.
I went out to a sample size of 1,000,000 with an expected conversion rate of 10%. To save my processor I graphed every 100th point. This is the graph you would expect:

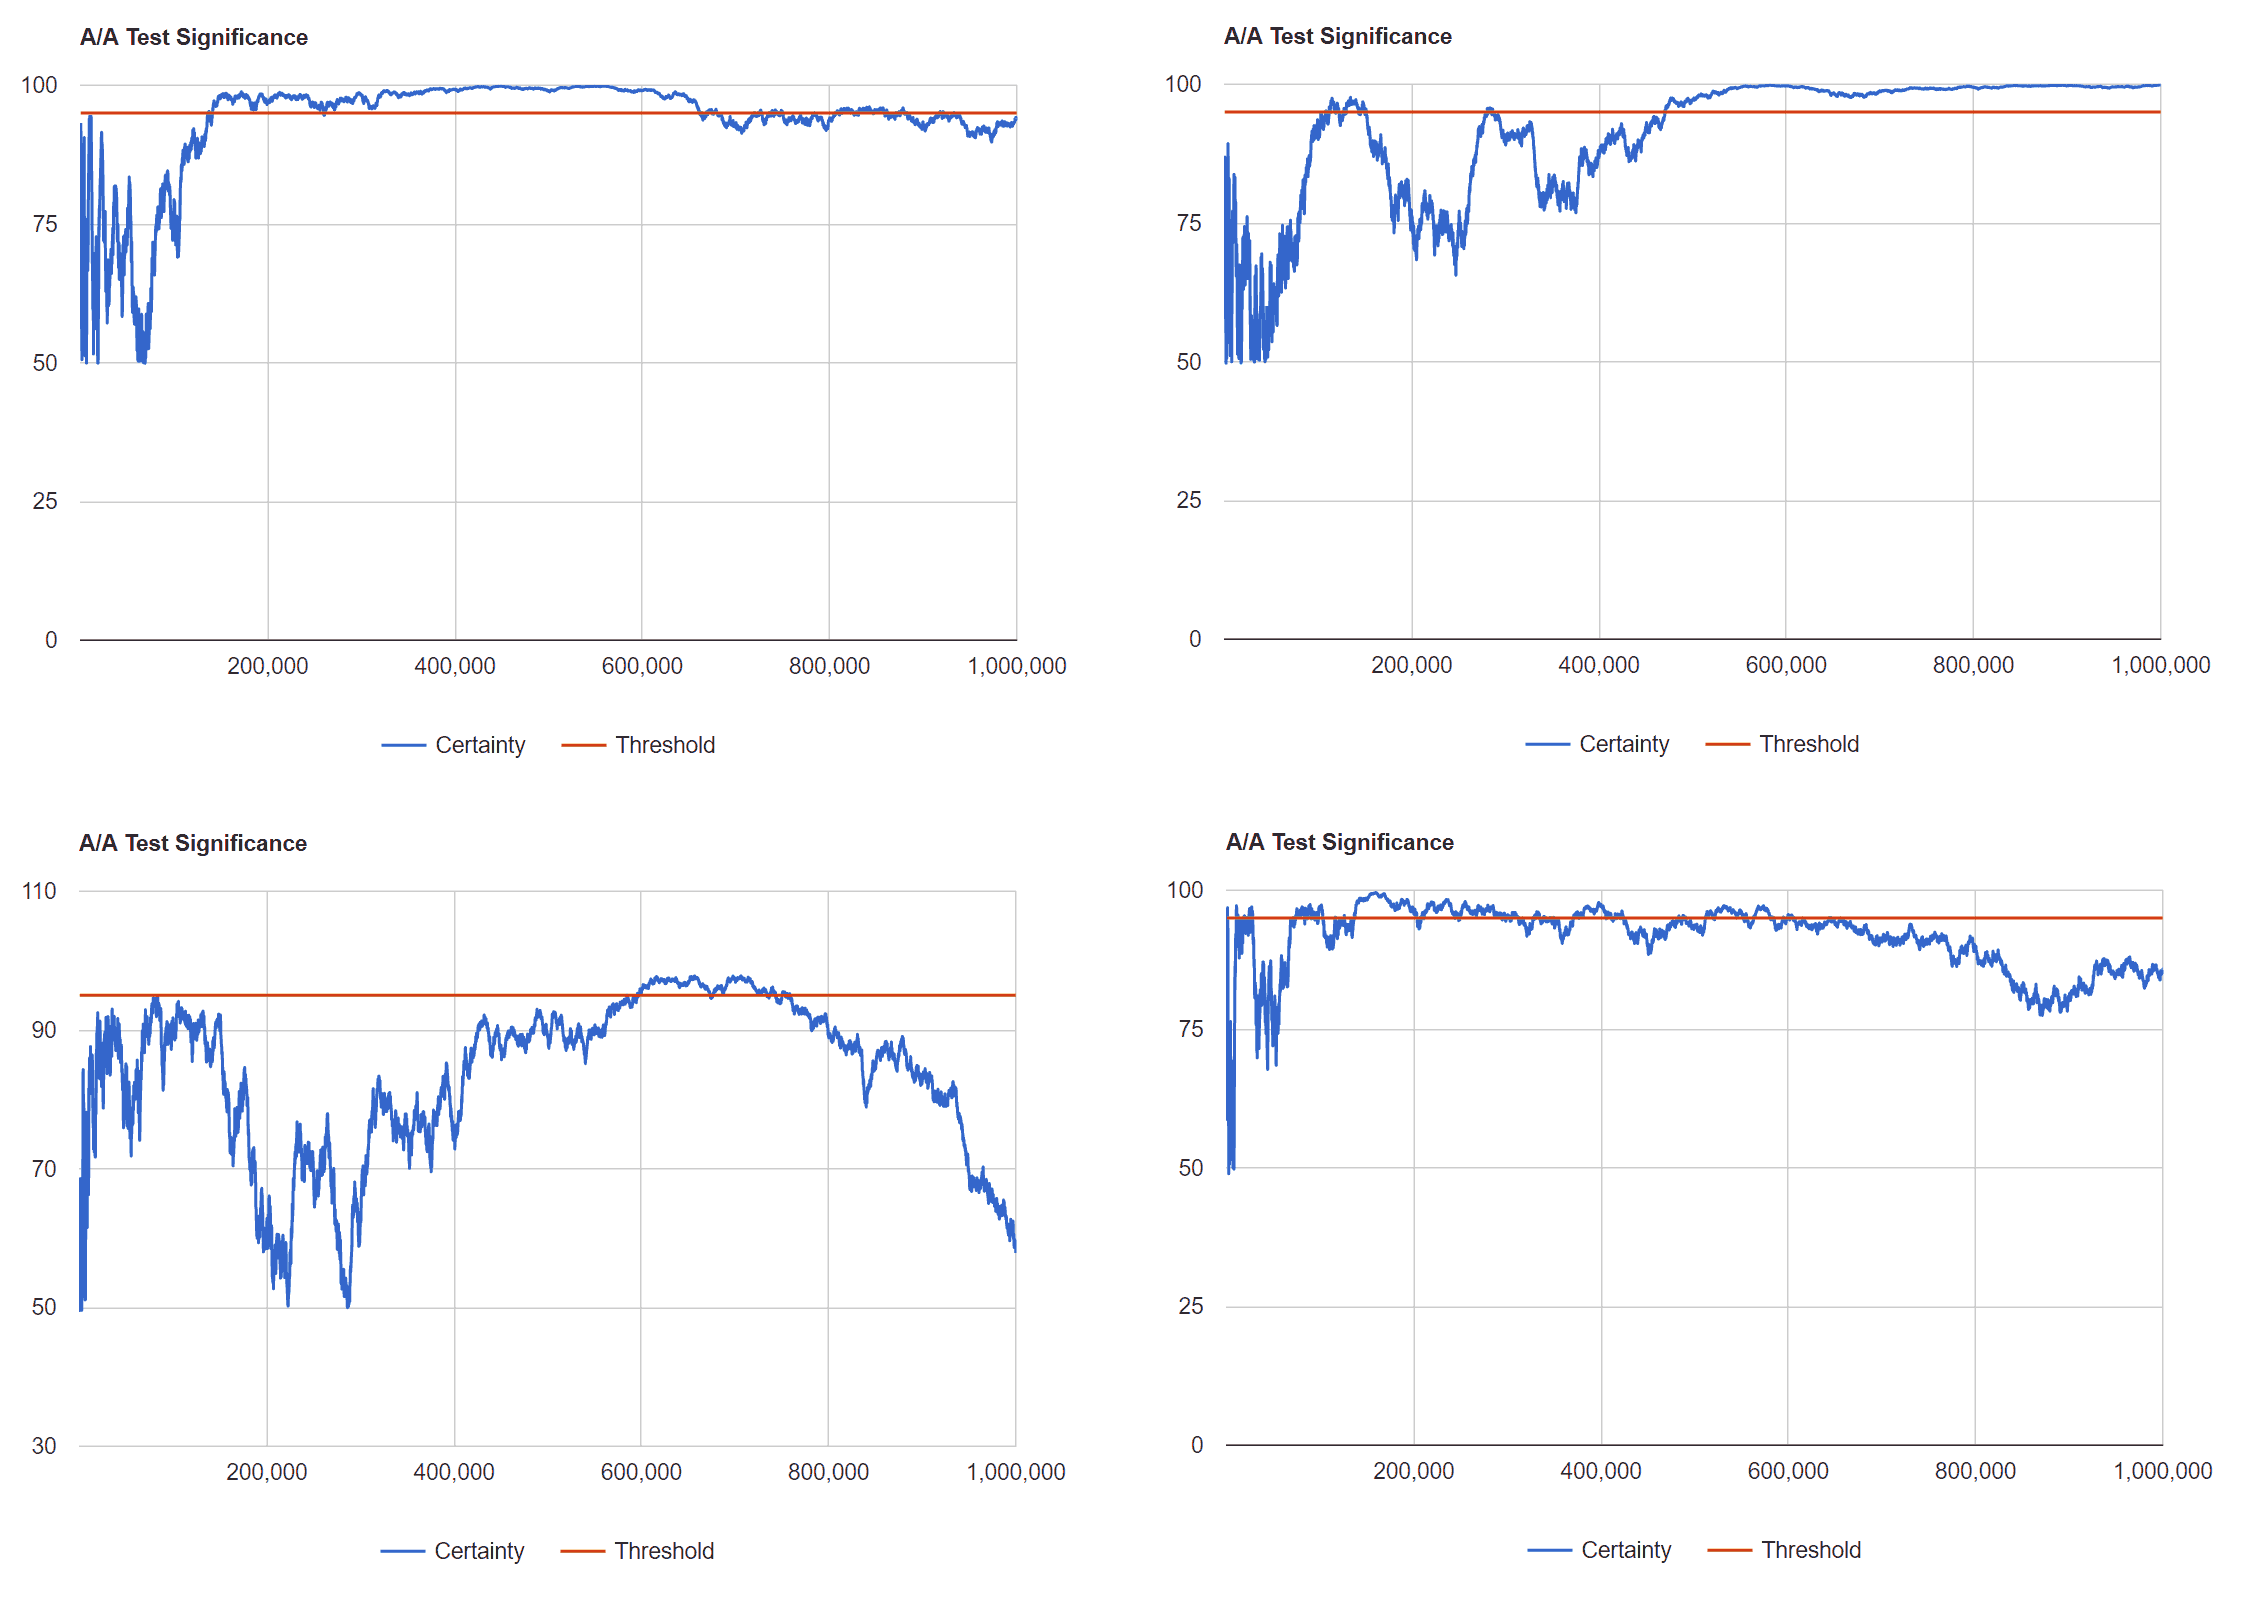
The random data would stay below the significance line. There was a small blip right in the beginning, but overall the calculator seems works. In reality it took me many tries to find that graph. These are the graphs we should expect:

This becomes even more severe as your conversion rate decreases. Given this data it becomes clear how these actions become serious issues.
End the test once it reaches statisitcal significance.
Many of the random data sets showed significance early on. There was simply not enough data to make a judgement. Don't end your A/B tests too early. You need to calculate a proper sample size prior to running your test.
To do this you will need to understand the expected impact. If you expect conversion rate to double, then don't accept anything less.
Continue to run the test until it shows statisitcal significance.
You spend days, maybe weeks, developing your test. You run the test and find no significant impact. It's very tempting to just give it another few weeks to run, hoping to come to a conclusion.
Unfortunately, this is almost as bad as ending early. Most formulas will eventually show significance if you make the sample size large enough. This can provide entertaining responses from your tools such as:
Test "B" converted 0% better than Test "A." We are 99% certain that the changes in Test "B" will improve your conversion rate.
Your A/B test is statistically significant!
Look at every possible metric to see what changes.
You setup a test designed to increase conversion rate, but at the end of the test there was no significant impact. Viewing the report you notice that AOV increased 20% for variation "B".
It feels great to hang your hat on that metric and call variation "B" a success, but is that impact real. The test was supposed to impact AOV.
If you look at enough data points you'll eventually find one showing a false positive. Stick to the metrics the test was designed for.
How data will make you do totally the wrong thing - Jason Cohen
The Lab
I'm embedding the code to run similar tests. Be warned that these tests will run on YOUR computer. If you make the values too large you will significantly peg your ram and processor and may freeze your computer.
Running the test multiple times you may be surprised how often statistical significance is reported. In fact most datasets report statistical significance at least once during run.
[Removed in site conversion]
